
Do you want to know how the Quick Analysis tool Excel works best for beginners? An expert always knows how to maintain the data in the meantime. They don’t even compromise their work efficiency for that. However, the case is different for beginners; they usually don’t know how to use Quick Analysis for professional work.
So, for beginners, the quick analysis tool must be easy to catch and applicable for work purposes. Also, for professionals, it must be quick to use and accurate in value. For a better understanding, you can have the taste of below mentioned detailed instructions and make your life easy.
Quick Analysis Tools to Make Your Work Easy
If you have ever used Microsoft Excel, then you already know about Quick Analysis. As the name depicts, it helps to examine the data you used on the spreadsheet. To work efficiently, it requires certain kinds of excel tools.
Quick Analysis can be used for various reasons, but it is mainly used for analyzing a wide range of data. You can get access to one of its tools, “Quick Access,” which helps to analyze the data of the specific cells. The button “Quick Access” is showing or not on the sheet; you can confirm it by looking at the lower section of the data selected for Analysis.
After confirming the button sign, click on it and check the available options. Do you see choices like FORMATTING, CHARTS, TOTALS, TABLES, and SPARKLINES? You will see all these options inside the Quick Access button. This tool is quite useful and easy to use for certain data. It helps to work on the selected data and also provides all the options which are related to specific values.
5 quick analysis tool excel that make your task easy
-
FORMATTING
If you want to color your data to differentiate the values of the existing one from the new one, then you should use “Conditional Formatting.” It helps to mark or color the specific value in the data by using a particular option such as Colors. With the help of this, you can readily distinguish the same value in the data and make changes according to that.
To use this tool, you have to select “Formatting,” and then you will see a new options bar, “Conditional Formatting.” Now, click on it and check the previews of the already written data. After checking the data, you can click on the specific options based on your needs.
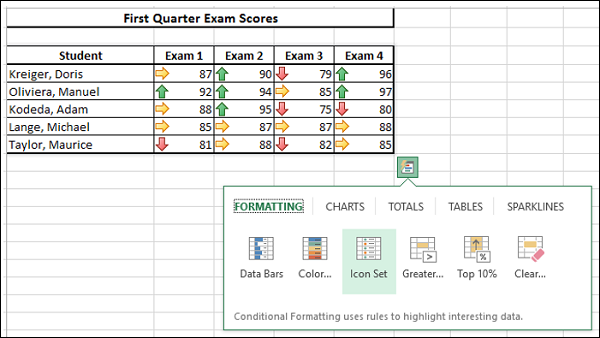
To make use of all the options of Conditional Formatting, you have to check “Ribbon,” which is available in the main menu. One of the plus points about Ribbon is it includes the Quick Analysis tool’s exclusive features too.
-
CHARTS
Charts are a part of the quick analysis tool excel to express the exact data in a visual form. A specific kind of data requires a specific kind of chart. So, you will see a unique chart for unique data.
To find the “CHARTS” for the specific data, you have to go into “Quick Analysis,” where you will see “CHARTS.” Now, you can check charts of the specific date and make sure that all the values are accurate.
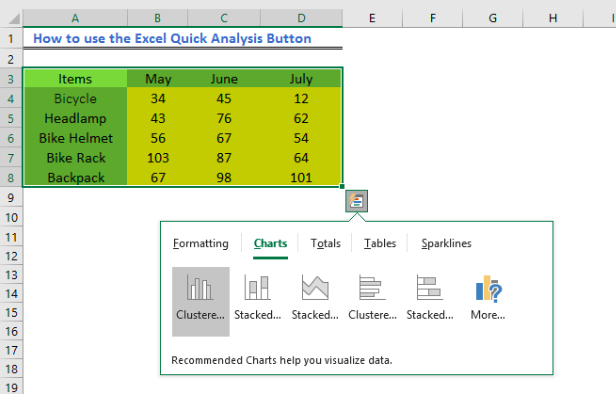
Do you have urgent work on the main chart page and have no clue about how to move to that without losing the other chart pages? Then use “MORE,” which lets you move to the “Main Chart Page.” Just click on it and then check for the previews; after that, confirm the preview. Now, you can choose the option and move to the next page.
-
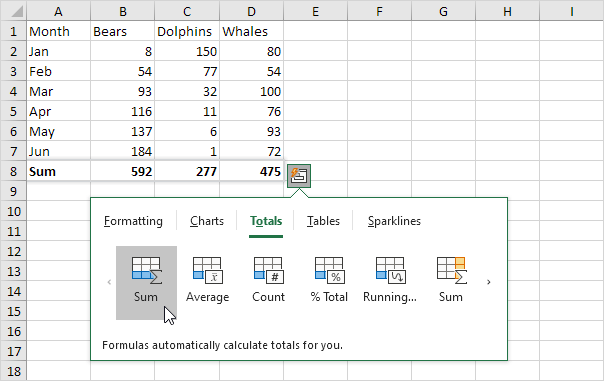
TOTALS
Totals is a special feature that is available in the “Quick Access” button of “Quick Analysis.” It is used to count the total number of rows and columns. To count the numbers, you have to use functions like Count, Sum, Average, and so on.
Here we will look at each feature of Totals one by one to learn about the actual process of the Quick Analysis tool.
Totals
Totals can help you to check the data in two ways, Row-wise and Column-wise. Both methods have specific processes to analyze the data. In row one, make sure that the specific data also includes a vacant row for calculation purposes.
Sum
Now, check the next option of TOTALS for Quick Analysis, Sum. The Sum is used to find the total value of the respective data. To calculate the Sum, you need to click on the particular data and select Sum to get the result. However, do not forget the check that the selected data also includes the vacant row. Or else, the system will pop up a text of already existing data instead of selected data. This can make your task difficult if you do not include the empty row with selected data.
Average
Average provides the mean value of the selected data. To calculate the average value, you need to click on the particular data and select the Average to get the mean value. The mean value of the selected data from each column displays in the vacant row.

Count
To use the Count, click on the selected data and select Count to calculate the total value. Like Average, the count value comes below the selected data in a row-wise manner. This function from TOTALS is counted as one of the most important quick analysis tool excel users need to calculate the selected data in the meantime.
% Total
To get the % Total, click on the selected data and select % Total to see the result. It displays the total value of the % Total in the vacant row.
Running Total
To receive the Running Total, click on the selected data and select Running Total to see the outcome. Like % Total, it displays the overall value of the selected data.
Sum of Columns
To get the exact value of the Sum of Columns, click on the selected data and then select the Sum of Columns. You will see the total number of columns used in the calculation.
However, keep the column vacant besides the selected data. Or else, your system will pop up a text of already existing data instead of selected data. This can make your data inaccurate if you don’t include the vacant column along with the selected data.
-
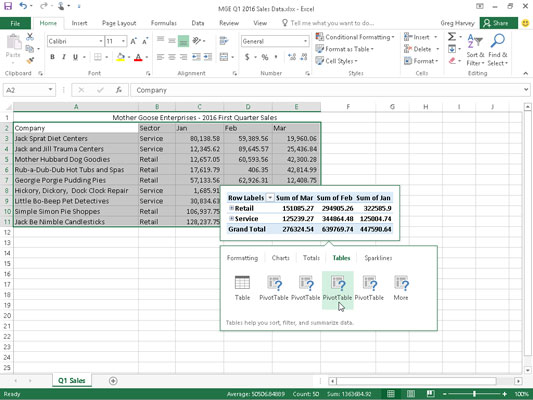
TABLES
Tables are a part of the quick analysis tool excel in operating the data by filtering, sorting, and summarizing. You can find the “Tables” and “PivotTable” options inside “Quick Access” under the name “TABLES.” Tables and PivotTables have different features, which work according to the preview of the data. In the case of Tables, you will see the preview of the respective data, whereas PivotTables show nothing in particular. It only shows the empty preview, which you need to fill with the selected data.
-
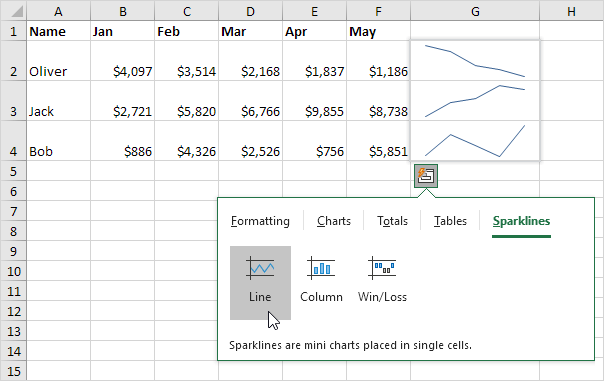
SPARKLINES
Now, move to the last part of “Quick Access” of Quick Analysis which is Sparklines. It is a representation of the selected data in the form of a small chart. These small charts reside with the data inside one or more than one cell. Sparklines help to provide a detailed analysis of trending data in a single-line form. This tool is essential for quickly monitoring the data.
Conclusion
Most professional workers are required to use a Quick Analysis tool Excel to collect and maintain the data in a particular spreadsheet. This tool helps to show results quickly and efficiently without compromising the data of the selected page.
So, if you are new here and want to learn Quick Analysis, then you can apply the above-mentioned detailed process and get a quick result by analyzing the data.
Hope our detailed knowledge of Quick Analysis will help you to overcome the burden of multiple works in the meantime.